Long Island Farm Stands (R , Leaflet)
A demo to show how easily a points-on-a-map map can be made using R’s Leaflet package. We will plot just a few of Long Island’s many Farm Stands. I am appreciative to Andrew Ba Tran for his PERFECT tutorials like these https://ctmirror.org/author/abtran/
Step one is to build a table of the name and address of each location that you will place a marker.
| Name | Address | long | lat |
|---|---|---|---|
| Center | Coram | -73.001516 | 40.87 |
| Meyers | 146 Piquets Lane Woodbury NY | -73.476595 | 40.808467 |
| Grossmans | 480 Hempstead Turnpike Malverne NY | -73.656629 | 40.706191 |
| Young's Farm | Hegemans Lane Old Brookville NY | -73.592277 | 40.833182 |
| Schmitts Family Farm | 6 Bagatelle Rd Dix Hills NY | -73..374976 | 40.796971 |
| Bayview Farm & Market | 891 Main Rd Aquebogue NY | -72..611185 | 40.947644 |
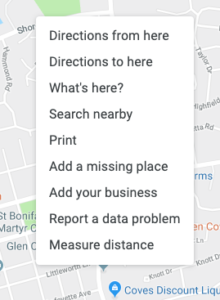
But notice the first line. This is not the address of a farm stand but the approximate middle of them all. Open a google map and think about where your points more or less will be and then zoom in to where you judge the center to be until you can see a single point like a street intersection. Right click that point and up will come a menu , select What’s Here? and at the bottom of the the page will appear the Latitude and Longitude of that point. This will be the center of your map. Not to fret too much about it . It is easy to go back and revise it.
And then at the bottom look for this :
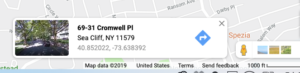
Next you will need to do the same to get the long and lat for each of your locations. One at a time enter the address into google maps, then click inside the marker that appears on the map , right click , select What’s Here ,and copy&paste the long and lat into your spreadsheet. Look to see if there are any negative signs.
When you are finished with that it is time to make the map in R.
Load these packages:
“`{r}
library(tidyverse)
library(leaflet)
“`
Next run this code:
“`{r}
map <- leaflet() %>%
addTiles() %>%
# Here is how yu set the middle of the map. Play around with zoom.
setView(lng= -73.001516, lat= 40.868909 , zoom = 9) %>%
# Here is where you add your list of markers and the pop-up text.
addMarkers(lng=-73.469030, lat=40.826010, popup=”<b>Meyers</b><br>146 Piquets Ln, Woodbury NY</a>”) %>%
addMarkers(lng= -73.656629, lat = 40.706191,popup = “<b>Grossmans </b><br>480 Hempstead Trnpk, Malverne NY</a>”) %>%
addMarkers(lng= -73.592277, lat = 40.833182,popup = “<b>Youngs Farm </b><br>Hegemens Lane, Old Brookville NY</a>”) %>%
addMarkers(lng= -73.374976, lat =40.796971 ,popup = “<b>Schmitt Family Farm </b><br>6 Bagetelle Rd, Dix Hills NY</a>”) %>%
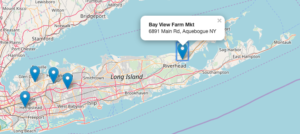
addMarkers(lng= -72.611185, lat = 40.947644 ,popup = “<b>Bay View Farm Mkt </b><br>6891 Main Rd, Aquebogue NY</a>”)
m
“`
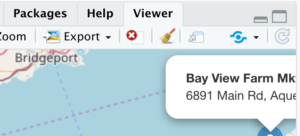
And that is all there is to it.
If you are using Rstudio one can easily publish it online and get a link to share it.
On the image viewer pane at the top click on that blue icon with the 3 parts.
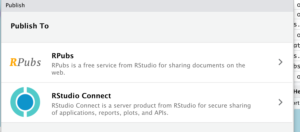
Next select the RPubs choice. This will publish your map online and provide you with a link to share it.
Here is the link to the one I did:
file:///Users/joefoley/Desktop/DataPrograms/RProjects/FirstRProject/FarmWeb.html
Recent Comments