Real Estate Network Graph (R, Igraph)
In this paper using both R and Neo4J we map out a strategy for real estate companies to make more money.
Unlike most other industries Real Estate companies cannot come out with new products or lower prices to increase sales. No one can be coerced into selling their home. The number of homes that will sell in a given year is beyond the real estate companies control. The only thing that real estate companies can do to make more money is to increase their share of the number of transactions that will occur.
In the same way that baseball players have Offense and Defense roles, realtors have Listing and Selling roles. In Real Estate parlance Listing is a homeowner hiring you to sell their home, Selling a home is finding the Buyer for that home. Sometimes the agent who gets the Listing also finds the buyer but this is usually not the case and we will ignore such instances.
Not all realtors sell the same number of houses , in fact it is very skewed. In the area that we will look at 24 agents out of hundreds listed ⅓ of all of the homes in 5yr period. Real Estate managers are myopic about the marquee amount of sales these Star Agents make and in an attempt to increase their market share futility try to recruit these Star Agents. I think there is a better approach.(A word about the data. We are using genuine MLS data covering 5 years worth of transactions . We have replaced all the identifying information with random information.)
Star Agents can rarely be induced to switch firms. Unlike average agents who work on a 50/50 split with the company whereby they evenly split any commission collected with their company Star Agents are often on a 80/20 split. That is about as much as a real estate company can offer and still manage to keep the lights on. Competing real estate companies have nothing more to offer to induce a Star Agent to switch to their firms. But we will show that it turns out that each star agent has a coterie of Selling Agents who consistently sell their listings . These Selling agents individually do not have eye catching sales numbers but if several of them are brought together , because they work at a lower commission rate, the real estate company can make more money than if it had recruited the Star Agent. The table shows that on $10million of sales the the real estate company of the Star Agent would have earned $40,000 while the real estate company of the Average Agent would have earned $100,000.
| Sales Amount | Commission Split | 4% commission on Sales Amount | We Assume Half goes to a 2nd agent | Split Btwn Agent-Co | |
| Star Agent | $10,000,000 | 80/20 | $400,000 | $200,000 | 160000 / 40000 |
| Average Agent 1 | $3,000,000 | 50/50 | $120,000 | $60,000 | 30000 / 30000 |
| Average Agent 2 | $3,000,000 | 50/50 | $120,000 | $60,000 | 30000 / 30000 |
| Average Agent 3 | $4,000,000 | 50/50 | $160,000 | $80,000 | 40000 / 40000 |
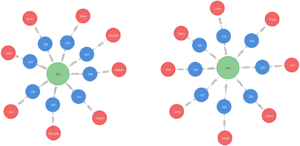
In this study we use actual data so all means of identification have been anonymized . Unfortunately this anonymity costs us some readability. Here is a simple graph using fabricated data to help explicate what our graph illustrates. In this example the green circles represent the top two listing agents and the red circles represent Selling Agents that sold the most of the Listing Agent’s listings. The blue circles represent the listing and what it sold for. Real estate companies should focus their recruitment efforts on acquiring the coterie of the Star Agents.
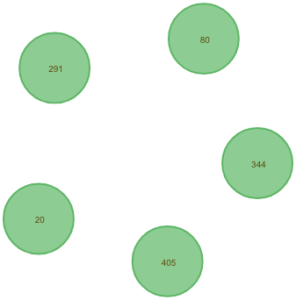
Using Neo4J and switching to actual data here are the top 5 Listing Agents
By clicking on the node and selecting the icon at the 6 o’clock position the sold Listings of this Listing agent appear.

Now do the same thing but to a blue node.. Notice the “legend” at the top. Green indicates the Listing Agent, Blue the Listing, and Red the Selling Agent. As can be seen in the table above it is these Red nodes, the coterie of the star Listing Agents Selling Agents that real estate firms would profit from recruiting.

Here is how the analyses was done.
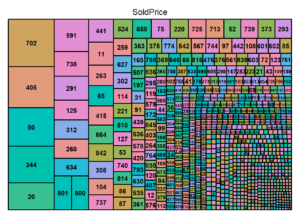
Our data looked like this:
| ListingID | ListingAgent | ListingBroker | SellingAgent | SellingBroker | SoldPrice | Year | ListingAgentName | SellingAgentName |
| 2728 | 702 | BAC | 36 | AEI | 585000 | 2006 | 20 | 775 |
| 1 | 47 | GF | 73 | II | 695000 | 2006 | 6 | 17 |
| 1019 | 259 | A0A | 115 | II | 330000 | 2006 | 731 | 979 |
| 712 | 125 | A0B | 306 | II | 465000 | 2006 | 20 | 775 |
| 965 | 226 | AAF | 348 | AEB | 470000 | 2006 | 20 | 775 |
| 1098 | 263 | BAC | 579 | AGC | 785000 | 2006 | 702 | 979 |
| 342 | 75 | FH | 600 | II | 1950000 | 2006 | 236 | 11 |
| 1837 | 405 | B0F | 608 | AFC | 677000 | 2006 | 2 | 8 |
| 6 | 447 | AAE | 657 | AEA | 530150 | 2006 | 316 | 15 |
| 2465 | 619 | DG | 824 | AGC | 3000000 | 2006 | 458 | 676 |
And can be found here: https://docs.google.com/spreadsheets/d/e/2PACX-1vQ3F_ZLfGeoQbW4IMXTXIiTmRMoLwYQeWcd3PguQwBGykjZVkJ3zeFRB-TK70sFomddf2e6_bMAYsxz/pub?gid=0&single=true&output=csv
The Data Processing and the Tree Graph were done in R and the at code can be found here: http://rpubs.com/Joe11579/451108
Recent Comments